Revamping Föli's Bus Tracker for the modern web
part of a series on Personal Projects & Optimizations
In this post, I’ll be discussing the technical details between the official Föli bus tracker (Bussit Kartalla), and how the alternative bus tracker I created works under the hood and how it compares performance-wise. We’ll also be talking about maps on the interweb!
This post assumes some basic knowledge of how the web works. There are surface-level explanations of some concepts.
let’s talk about maps
There’s a lot of ways to do maps on the web. One of the most popular open source libraries (also used by live.foli.fi) is Leaflet.js, which is a lightweight and easy-to-use library for interactive maps. But importantly, we’ll be talking about its tile layer system.
leaflet & raster maps
Leaflet utilizes raster map tiles. Map tiles are essentially small pre-rendered images that are stitched together to form a larger map. When you zoom in or out, or pan around the map, these tiles must be loaded again to reflect the new view. Here, the performance and usability of the map can take a hit.
On live.foli.fi, when you zoom the map, you aren’t so much zooming in on the map, but switching between different sets of pre-rendered tiles, pre-configured zoom levels. The zoom can therefore appear janky, and loading times can be impacted when a lot of images need to be loaded.
I should clarify that I am not presenting Leaflet.js or rasters maps as inferior solutions - they have their use cases, and live.foli.fi works perfectly fine for its purpose, and is ultimately less resource consuming than what is about to be proposed. However, there are alternatives to raster maps.
how live.foli.fi does maps
Live.foli.fi uses Leaflet, likely for its high compatibility and simplicity. Let’s take a look:
As seen in the video and as stated before, the switching of zoom states is apparent. Also, the stop markers are behaving a bit oddly - like they’re a bit desynced, even. This is because the markers are separate DOM elements on top of the map tiles, and they need to be repositioned whenever the map view changes. This opens up problems, though. Having hundreds of DOM elements on the board at once is a huge performance hit.
why are raster maps slower?
Let’s look at how the browser DOM (Document Object Model) works. This will be a surface level look to understand the performance implications. Leaflet and similar libraries create a HTML element for each marker (<div>, <img>, etc). These elements live in the page’s DOM tree. 1,000 markers means 1,000 DOM nodes in an overlay layer. Each marker has CSS styles (for position, icon image, etc.) and is part of the document’s layout.
The browser goes through multiple stages to render them:
- Style Calculation: The browser computes the styles for each marker based on CSS rules.
- Layout (Reflow): The browser calculates the position and size of each marker in the layout. This is pretty computationally expensive.
- Paint: The browser fills in pixels for each marker on the screen.
- Compositing: The browser combines all layers (map tiles, markers, etc.) into the final image displayed to the user.
When you have a large number of markers, each of these steps becomes more computationally intensive. In DOM rendering, any update that affects layout triggers reflow, and usually a repaint and composite of the affected area. Reflow is more computationally intensive and can significantly impact performance, especially on complex pages with a dense structure of nested elements.
In conclusion, hundreds of DOM nodes updating constantly can bog down the browser’s main thread. This causes stutter and lag.
There’s some optimizations the browser attempts, but it’s a bit outside the scope of this writeup.
the alternative: canvas-based maps
As a public service, Föli’s service prioritizes older devices and compatibility. But since we’re kind of just winging it, we’re not constrained by legislation or compatibility requirements. We’re building for the ‘majority’ of users, and can therefore leverage more modern web technologies.
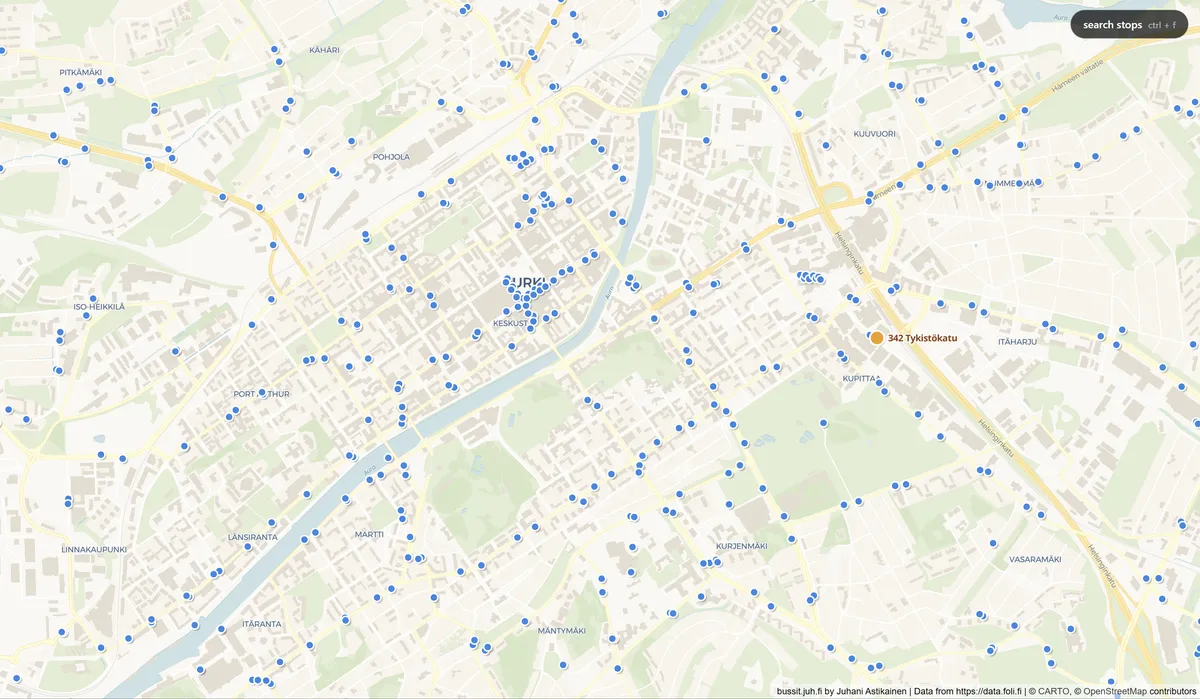
bussit.juh.fi uses canvas-based maps instead, powered by MapLibre GL JS & react-map-gl.
We leverage WebGL to render the map and markers directly onto a single <canvas> element. This approach is significantly faster for rendering, because it bypasses
a lot of the DOM overhead.
As mentioned previously, rendering hundreds of DOM elements is slow and causes tons of reflows. The canvas is just a single element! The browser can effectively outsource the rendering to the GPU, which is optimized for handling large numbers of graphical objects.
The 30fps laggy recording is not doing either of these sites justice, but you’ve (probably) already seen it in action anyways.
Oh, yeah! One more thing with the vector maps. Since the tiles aren’t pre-rendered images with the text baked in, the map can be rotated! This wouldn’t really work with raster tiles, since the text in the existing tiles would not rotate alongside the map (this would be horrible UX). In three dimensions as well! Pretty awesome.
Watch as the text labels position accurately as the map rotates.
other optimizations
bandwidth
live.foli.fi loads quite a bit of data on a consistent basis. In fact, every 4 seconds, the application fetches their entire bus location dataset again. The dataset itself is around 1,4MB in size on a regular day during business hours. While this gets compressed over transmission, it’s quite a lot of data for the application to be processing on a 4 second basis, regardless of application state.
What’s going on here? Let’s look at the bus location dataset request, which we’ll be referring to as the vm request:
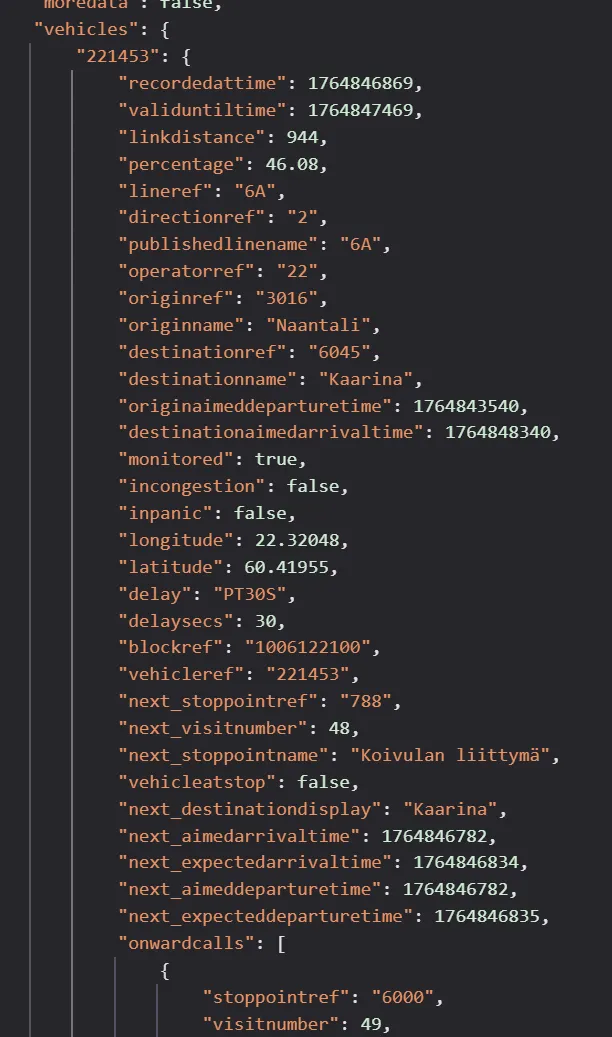
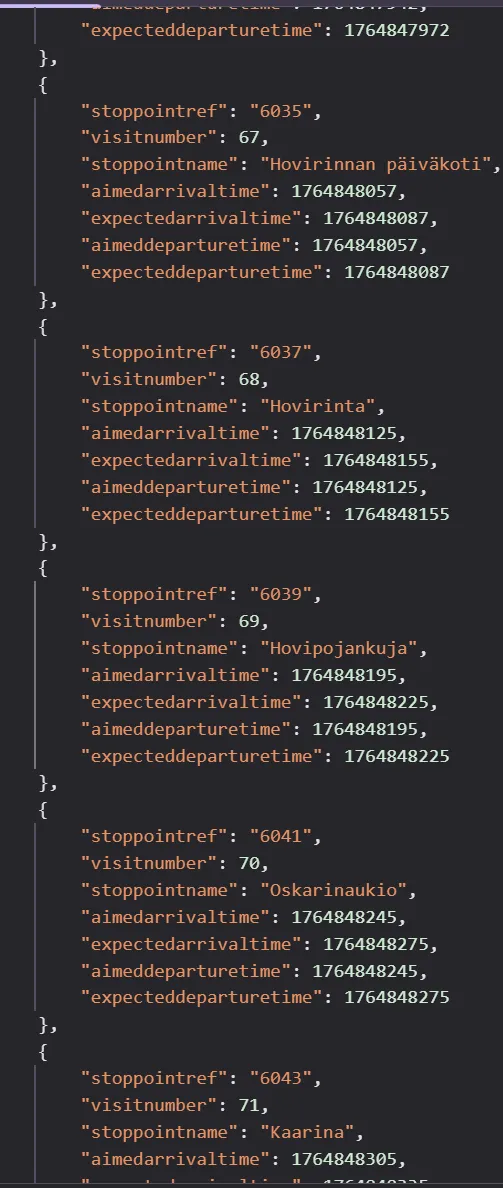
That’s a lot of data - and what’s especially suprising is the amount of scheduling data being transmitted. Upcoming stops for each bus, going into quite a bit of detail for dozens of stops.
This is good data to have, but not necessarily something that needs to be transmitted every 4 seconds for a large fleet of vehicles for the purposes of only tracking their locations on a map.
Of course, the developers are aware of this. Here’s a snippet from their public data repository, where they outline their recommendations for using this public API:

“Please note that VM-reply is large, so polling VM with handhelds consumes fair amount of bandwidth.” Well, they’re right! But this is ultimately what their own public service does.
They also go on to state that if transforming of the data is required, the user should implement their own caching server. Excellent idea!
So this is what bussit.juh.fi does. The vm polling is done by a dedicated proxy layer service, that fetches the full dataset every 4 seconds on the server, but only serves the necessary data to the client.
We’re saving quite a bit on user bandwidth this way.
On a casual saturday afternoon, the vm request size on Föli’s service is transmitted at around 302kB (compressed, 1,145kB uncompressed), whereas on bussit.juh.fi, the same request is a healthy 0.8kB over network (1.4kB uncompressed).
Map-wise we’re using vector tiles instead of raster tiles, which also saves on bandwidth. One raster request for a single tile can be around 90kB-200kB depending on zoom level and area, whereas a vector tile request is usually around 1kB-60kB.
in conclusion
bussit.juh.fi makes steps forward performance-wise. But it’s not necessarily a superior product or service. live.foli.fi prioritizes compatibility, which is important for a public service. It focuses more on reliability and accessibility, which bussit.juh.fi does not make a priority.
Bussit.juh.fi uses several times less bandwidth, and the bus queries are up to 100x smaller in size. The map also performs significantly better on modern devices, with smooth zooming and panning, as well as map rotation. Bandwidth is saved here as well.
Bandwidth is ultimately not an indicator of performance or a service’s quality. Bussit.juh.fi offloads map rendering to the client GPU, which is a significant performance boost in exchange for system resources. live.foli.fi is far more lightweight on this front.
It’s important to recognize the distinct goals of each service. This has been mostly a technical demo, which I’m happy with.
Those bandwidth savings are real, though - and could be a step forward for the official tracker.